What’s Hot…And What’s Not –– Part Seven
Frank’s Top 20 Top FEC Attractions and Why

Frank Seninsky
by Frank Seninsky, President/CEO Amusement Entertainment Management (AEM) & Alpha-Omega Amusements & Sales
Last month, we covered 16 key considerations you must take into account when evaluating and choosing the best attraction for each unique FEC. (Read Frank’s 16-point checklist in the November issue or online at either www.replaymag.com/frank-talk-1118 or on Frank’s blog at frank-thecrank.com.)
Once you’ve taken each of those 16 points into account, it comes down to figuring out what your projected revenue is going to be for that particular attraction and how it increases your target market reach, frequency of visitation and, most importantly, how much it will increase your facility’s total net revenue.
Getting Started
The first point of reference is to provide some of the average per capitas (“per caps” in industry lingo) of my top 20 attraction picks. This is an across-the-country look at what each generates in revenue as it relates to a percentage of the total revenue for different sizes of FECs. Remember that the percentage of total revenue for each attraction decreases (as does its per cap) as the number of attractions and revenue-generating services an FEC offers increases.
So, in simple terms, per capita is a percentage of what a particular attraction earns in a FEC. But when we’re looking at the numbers out there, we’re really just uncovering the percentage of revenue an attraction brings in within someone else’s location. How much something earns is dependent upon how many attractions there are in the facility and what the per capita is for that particular area and size of facility, and it’s going to be different for each location. In short, those numbers are going to be all over the place. But, understanding the real-world financials of FECs in operation does give my team at AEM a big advantage in zeroing in on any specific market.
As a simple math example, a pair of mini bowling lanes that cost $52,000 and generates $1,000/week (or $52,000 annually) in a $20-per-capita facility grossing $2.6 million per year ends up generating just 2 percent of total revenues (or an average 40 cents per capita per visit). That may not seem like a lot, but it is enough for the mini bowling lanes to earn in a single year what those lanes cost (a 1:1 ratio), satisfying one of the “requirements” we covered last month. As a side note, this facility has an annual attendance of 130,000. To back up our math (a good practice to avoid mistakes), we see it checks out: $0.40 x 130,000 = $52,000.
Another example might be a bowling center that grosses $2.1 million annually that has a laser tag arena (the only attraction outside of bowling) that brings in $300,000 each year (or 14.29 percent of total revenue). Using a $15 per capita average spending for this market, equates the laser tag’s average per capita at $2.14. This bowling center has an attendance of 140,000. To back up our math, $2.14 x 140,000 = $299,600 (close enough).
So, in simple terms, this is what average per capita is and why it’s key for ranking attractions.
AEM has access to over 1,200 actual financials from FECs throughout the planet that show what each attraction earns and its per capita, so I believe that puts me in a unique position to give readers a realistic Top 20 that makes sense, even with all the disclaimers of “different” demographics, per capita spending, average household income and average median household income, facility square footage, the percentage of total FEC square footage the attraction takes up, whether or not the attraction is the anchor attraction, the FEC’s rent plus CAM (common area maintenance), the price perplay, alcohol/no alcohol, etc.
Frank’s Top Indoor FEC Attractions
Here is the list of my top-tier indoor anchor attractions for FECs:
• Bowling: This includes everything from regulation to open play, plus leagues plus shoe rentals. About 60 million people bowl at least once annually! A $6 to $7 per cap average is reasonable.• Go-Karts: Yes, these take up a lot of space but people drive further for this attraction since there are not that many indoor tracks. You’re looking at a $7 to $8 per cap if go-karts are 25 percent of total revenue. Pro-karting gets a much higher per cap.
• Laser Tag (Multi-level): This is usually the first choice added to a bowling center. Across the board, a $2 to $3 per cap for FECs is reasonable, but I have seen $1.75 and also $3.50 per caps.
• Soft Play: A $1 to $2 per cap is reasonable depending on the size of the play unit and the number of elements. I have seen higher per caps ($5.00) at children’s centers that have just a large softplay unit and charge an entrance fee. When I calculate the per caps, I am counting all attendance, even the parents. For this article, I am concentrating on softplay as one of an FEC’s multiple attractions.
• Ice Skating/Hockey or Skatepark or Roller Skating: This depends on size and investment, but the per cap range is $10 to $12.
While those are clearly the cream of the crop, there are a lot of great attractions in this second tier of indoor FEC attractions:
• Major Ride (a Himalaya for example): You’re looking at a $3 per cap average, but this depends on what ride it is and its price tag.
• Ninja Warrior Courses: Sizes run 20’ x 50’ and larger (and higher). Revenue ranges are from $60,000 to $250,000 with a per cap range of $0.60 to $2.50.
• Blacklight Mini-Golf (either 9 or 18 holes): $0.75 to $1.75 per cap at $75,000 to $175,000 in gross revenues.
• Virtual Reality Arenas/Stations (two to eight players): This includes Hologate, Virtuix Omniverse VR Arena, ModalVR. Most are averaging $2,000 per week with $1 to $2 per cap.
• Ropes Courses – A $1.50 to $2.75 per cap is reasonable (remember these usually go above other attractions or services).
• Escape Rooms, Puzzle Rooms, Story Rooms: This is very viable assuming there are a minimum of three rooms. Per caps range from $5 to $7 since many charge an hourly fee and the number of participants ranges from two to as high as 10 per session.
• Triotech’s XD Dark Ride: The $1.30 per cap depends on how many seats. Most FECs would have four or eight seats.
• Trampoline Jump Pads: Assuming six to eight jump pads, the per cap is $1.00 to $1.50.
• Mini-Golf Regular (18 holes): $1.00 to $1.50 per cap when offering a quality, challenging course
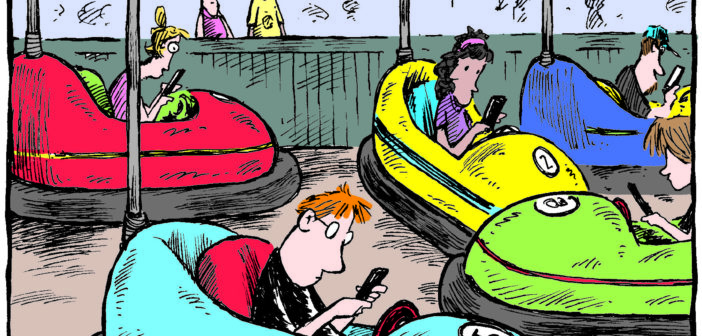
• Bumper Cars (and subset items like Lazer Fury, Spin Zone and Flip Zone from Amusement Products): 75 cents to $1 per cap.
• Rock Climbing Walls: For low-throughput, one-attendant attractions with two stations, a 50-cent per cap is reasonable.
• Laser Maze (10’x20’): Per cap ranges from 50 to 75 cents with $50,000 to $75,000 gross revenues.
• Mini Bowling (two lanes): 50 cents to 60 cents per cap (this per cap would be almost double for four lanes).
• Iron Rides: This category includes Dragon Coasters, kiddie roller coasters, carousels and smaller indoor rides, plus rides that go up in the air and come down like Frog Hopper. Per caps are 50 cents to 75 cents.
Honorable Mention Indoor Attractions (in no particular order):
• Photo, Movie, Karaoke, Recording Booths (too varied to get an accurate average per cap)
• Axe Throwing, Archery, Knife Throwing
• Interactive Floors, Walls, etc.
• Indoor Batting Cages (usually do not do well indoors unless you have a good hitting instructor)
• Shooting Galleries
• Sports Simulators (golf, football, baseball, etc.)
• Inflatables
• Projection Attractions like Eye Click (if you can charge for use).
The Great Outdoors
In case you’re curious, these are my picks for the top-tier outdoor attractions that do best in pocket parks (in order):
• Go-Karts
• Mini-Golf
• Bumper Boats
• Rides/Iron Rides
• Driving Ranges
Second-tier outdoor attractions (in no particular order):
• Spray Parks/Splash Mats
• Paintball
• Tactical Laser Tag
• Water Playgrounds
• Zip Lines
• Batting Cages (baseball and softball)
• Outdoor Trampolines (low throughput if one person per trampoline)
• Mazes – small
• Water Wars
• Par 3 Golf
• Galaxy brand attractions
• Extreme Sports Parks
• Picnic Areas
• Hay Rides
• Off-Road Competition Courses
• Drone Racing (also run on indoor go-kart tracks)
• Slides
• Extreme Sports – Parachute Drops, Freefalls, Parachute Simulators
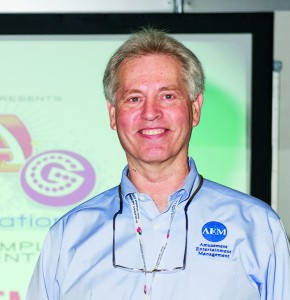
Frank Seninsky is president of the Alpha-Omega Group of companies, which includes a consulting agency (Amusement Entertainment Management), two nationwide revenue-sharing equipment suppliers (Alpha-Omega Amusements and Alpha-BET Entertainment), and Alpha-Omega Sales, a full-line game and related equipment distributor. During his 47 years in the leisure entertainment industry, Seninsky has presented nearly 400 seminars and continues to regularly write columns in numerous trade publications. He served as president of the AMOA (and was on the board for 22 years), and was president of IALEI (founding member and on the board for 11 years). Frank is the sole owner of Foundations Entertainment University, now in its 16th year. He is also considered a leading industry expert in the design, layout, and operations of coin-/debit card-operated arcades and FEC attractions, and is often called upon as an expert witness in cases involving the amusement industry. Frank edits The Redemption & FEC Report e-newsletter (35,000+ readers worldwide) and also writes a blog at www. frank-thecrank.com. Frank can be reached by phone at 732- 616-5345 or by email at [email protected] (website: www.AEMLLC.com).


1 Comment
Pingback: What’s Hot… And What’s Not – Part Seven - Frank 'the Crank' Seninsky Blog